The writers of The West Wing, the American political drama that broadcast from 1999 to 2006, were good, but not this good. Thus far, the 2024 presidential election has all the requisite ingredients for a blockbuster – an Emmy award-winning production. Two long-time foes battling for control of the Executive Branch. A shocking and pivotal debate that political wonks will recount for years. The certification of a new Democratic presidential nominee 100 days before the election. So please understand that, given these plot twists, we at IR+M are not in the business of predicting interest rates or election outcomes - especially this year. Instead, we focus on what we believe we do best, which is building durable, election outcome-agnostic portfolios.
 Reply Hazy. Try Again.
As we head into the final fortnight before the election, new polls and prognostications are emerging daily. We believe that these indicators are as valid as those proffered by a Magic 8 Ball, that fortune-telling billiards ball from our childhood. If we were to ask, “Who will win the presidential election?” the response might be, “Reply hazy. Try again.” But if we were to ask, “Are our portfolios constructed to weather any outcome and resulting volatility?” the probable answer would be, “Signs point to yes.” So, let’s not continue to bury the lead and instead dive into our market observations and expectations, as well as our portfolio positioning for November and beyond.
- Spreads are not usually influenced by the next Commander in Chief. With history as a guide, credit spreads are usually impervious to the incoming administration. Why? It takes time for the president-elect to enact their policies, and even longer for these policies to affect growth and corporate earnings. Instead, spreads are typically swayed by prospects for economic growth and interest rates.
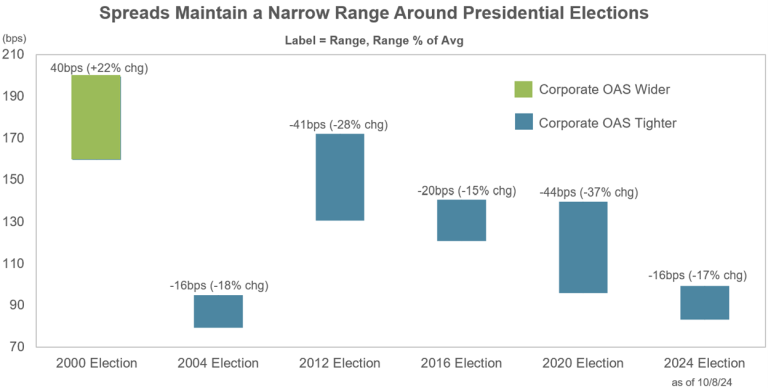
- Spreads are generally unfazed by political party. Dating back to 2000, in the three months surrounding a presidential election, investment-grade corporate spreads typically move within a narrow range. The exception was in 2008, which was excluded from this chart because of the extreme spread volatility caused by the Great Financial Crisis.
- Not surprisingly, this year’s supply has been front-loaded. In typical election-year form, US high-grade corporate supply has been pulled forward in 2024. Through mid-October, the market has digested $1.3 trillion in issuance, which is 29% higher than that of 2023. Aside from the 2020 election year, 2024 supply has already surpassed every other year’s 10-month total since at least 2000. We anticipate that post-election supply will be net negative, which will be a positive technical.
- This is not déjà vu all over again. While the 2024 presidential election has shades of 2016 and 2020, the prevailing Treasury yields are quite different. Leading up to election day in 2016 and 2020, front-end Treasury yields were below 1% and provided less relative value than other securities. Fast forward to today, and the story is a different one. Front-end yields are hovering around 4%, and we continue to see opportunity in the short end broadly. With the Fed expected to further lower interest rates, investors may finally abandon money market funds and look to extend duration and add sector diversification.
 It Is Decidedly So.
With so much election-related noise congesting the airwaves and our inboxes, is it possible to parse through it all and focus on what matters most? According to our Magic 8 Ball, “It is decidedly so.” As we think about our investment approach and the portfolios, we believe there are four key areas that deserve our undivided attention: taxes, tariffs, anti-trust, and tax-exemption.
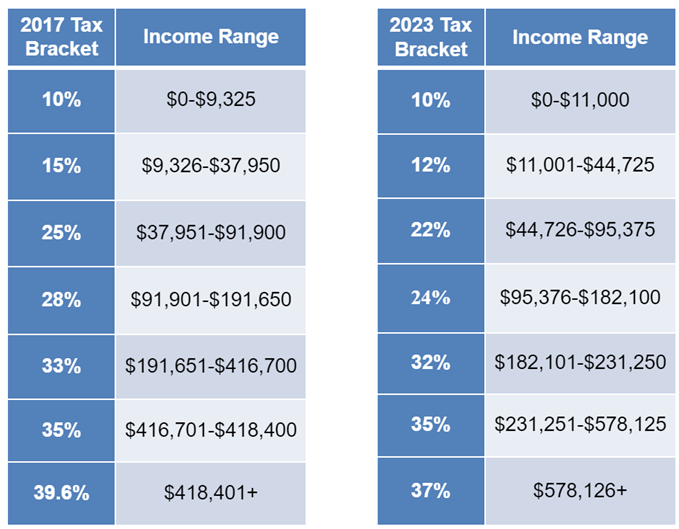
- Taxes - “The hardest thing in the world to understand is the income tax.” – Albert Einstein. The Tax Cuts and Jobs Act (TCJA), which was signed into law in December 2017, was the largest tax code overhaul in three decades. With the TCJA, some of the tax changes are temporary and set to expire in late 2025. Kamala Harris is likely to bring back the 39.6% personal income tax bracket, and Donald Trump could extend the current rates. While the 21% corporate tax rate is permanent, Trump may decrease it to as low as 15%, and Harris may raise it to 28%. For reference, the pre-TCJA and current tax rate brackets are below.
|
|
What to watch. Trump’s likely position on lowering tax rates could be a credit negative for municipal bonds. Lower tax revenue could result in an increased federal deficit. Harris’ proclivity for higher taxes could be a boon for the municipal market, which could experience elevated demand for tax-exempt bonds. |
- Tariffs - another word for import taxes. On the campaign trail, the two presidential candidates have repeatedly clashed over tariffs, which Harris has called a “sales tax on the American people.” President Biden has maintained Trump’s sweeping tariffs on Chinese-made goods, and in September, further increased them on products such as electric vehicles and solar cells. Trump has floated enacting a 60% tariff on Chinese imports specifically, and a 10% tariff on all imports generally. More recently, Trump has gone a step beyond and vowed to increase tariffs on imported cars to possibly 200%.
|
|
What to watch. Under Section 232 of the Trade Expansion Act of 1962, the president can raise tariffs on imports that pose a threat to national security. Section 232 grants the president the power to implement these tariffs without Congressional approval. If extensive tariffs are enacted against China and other countries, these nations could respond with retaliatory tariffs against US companies, igniting inflation for US consumers. |
- Anti-trust – enforcement changes could be on the horizon. With Federal Trade Commission (FTC) Chair Lina Kahn working on an expired contract, a new regime could be forthcoming for anti-trust enforcement. The Biden administration has long been focused on anti-trust issues, which have discouraged M&A activity, particularly in the technology sector. Harris has demonstrated some resistance to mergers in the past, but her California roots now have her courting business and tech leaders. Historically, the Republican party has been more hands-off regarding regulation. Also, Republicans have not embraced the technology industry due to the sector’s stance on free speech and censorship.
|
|
What to watch. In breaking with Republican tradition, vice presidential candidate J.D. Vance has expressed support for FTC Chair Lina Kahn. Kahn has railed against allowing fewer companies to control more of the market, as with the proposed Kroger and Albertsons grocery chain merger. With Vance leading the charge on a conservative crackdown on Big Tech censorship, Kahn – and maybe Elon Musk – may find themselves with West Wing offices in 2025. |
- Tax-exemption - the possible wildcard. With certain TCJA provisions set to expire, astute market observers have been thoroughly vetting the potential impact on municipal bond investors. Higher personal income tax rates could be a positive for municipal bond demand. Conversely, the removal of the state and local tax (SALT) deduction could be a negative. But what about that six-sigma event of possibly rolling back municipal bonds’ federal tax exemption? While this outcome is extremely unlikely, there is some precedence. In 2017, the TCJA eliminated advance refunding and tax-credit bonds.
|
|
What to watch. Trump has frequently questioned why universities are allowed to issue tax-exempt debt, and Vance has introduced bills that would raise the excise tax on universities’ endowment income. |
 Outlook Good.
The next few weeks will be decidedly eventful ones, with the presidential election on November 5th and the Fed meeting on November 7th. As in 2020, it may take days to determine who will be the 47th president of the United States. At IR+M, we remain focused not on who will be in the Oval Office, but rather what draws us to our office – our clients. For our clients, we are committed to constructing enduring portfolios that we believe are ballasts in any storm – interest-rate, election-outcome, or otherwise-induced.
Download Article
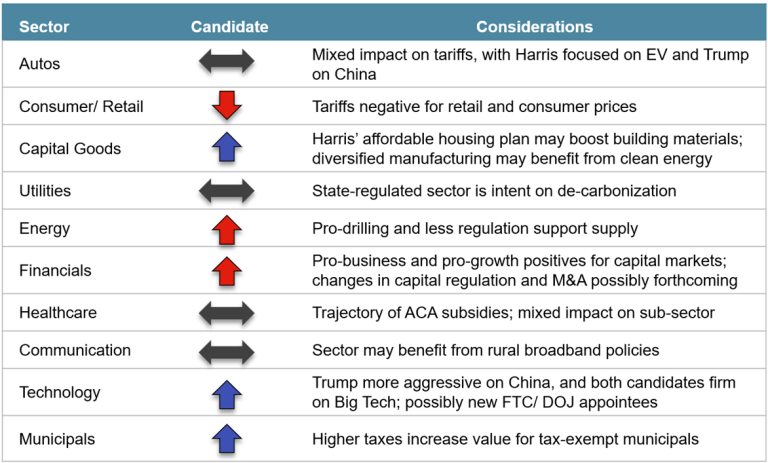
Sources: Spreads chart: Corporate OAS is based on Bloomberg Corporate Index from 8/31/00 to 10/8/24. OAS changes are based on daily values. Sector chart: Bloomberg as of 9/30/24 and IR+M Analytics. Directional arrows indicate increase, decrease, and neutral. Arrow Colors: blue represents Harris Administration, red represents Trump Administration, and dark gray represents neutral. Supply data from Bloomberg as of 10/22/24.
The views contained in this report are those of IR+M and are based on information obtained by IR+M from sources that are believed to be reliable but IR+M makes no guarantee as to the accuracy or completeness of the underlying third-party data used to form IR+M’s views and opinions. This report is for informational purposes only and is not intended to provide specific advice, recommendations, or projected returns for any particular IR+M product. No part of this material may be reproduced in any form, or referred to in any other publication, without express written permission from IR+M. “Bloomberg®” and Bloomberg Indices are service marks of Bloomberg Finance L.P. and its affiliates, including Bloomberg Index Services Limited (“BISL”), the administrator of the index (collectively, “Bloomberg”) and have been licensed for use for certain purposes by IR+M. Bloomberg is not affiliated with IR+M, and Bloomberg does not approve, endorse, review, or recommend the products described herein. Bloomberg does not guarantee the timeliness, accurateness, or completeness of any data or information relating to any IR+M product.


 Reply Hazy. Try Again.


